- Problem Definition
A Mining company is reviewing the problems that leading to over budget and schedule delay. They need to do pareto analysis for lesson learned for the next big project, on what problem that they need to be more focus on.
2. Identify the Feasible Alternative
Using 15 years data during the exploitation period, they found top 10 problems that contribute to the over budget and delay of the projects. They are:
- Scope was not defined properly in feasibility studies.
- Cost estimate was not accurate due to lack of define scope.
- Unrealistic schedule as contractors didn’t properly analyzed the project scope.
- Ambiguity of the contract documents, leading to disputes over technical specification requirements
- Inadequate documentation to support positions and resolve issues that develop during the execution of the project or retrospectively when large claims develop at the end of the project.
- Changed in Design criteria leads to change in mining method and leads to cost and schedule overruns.
- Lack of co-ordination with different disciplines leads to delay in construction.
- Insufficient time during planning stage, leads to poor planning at the beginning.
- Logistic support was not managed properly.
- Owners do not develop a sufficient master project schedule that results from pulling together the work activities from multiple prime contractors.
3. Development of the Outcome for Alternative
A Pareto chart will be generated for analyzing what problems need first attention.
Pareto Analysis is a statistical technique in decision-making used for the selection of a limited number of tasks that produce significant overall effect. It uses the Pareto Principle (also known as the 80/20 rule) the idea that by doing 20% of the work you can generate 80% of the benefit of doing the entire job.
Here, they will identify the problems which have the greatest cumulative effect on project delays and over budget using Pareto chart as a vertical bar graph in which values are plotted in decreasing order of relative frequency from left to right.
| No | Problems | Count | Cumulative Count | Cumulative Percent |
| 1 | Scope was not defined properly in feasibility studies. | 70 | 70 | 22% |
| 2 | Cost estimate was not accurate due to lack of define scope. | 65 | 135 | 42% |
| 3 | Unrealistic schedule as contractors didn’t properly analyzed the project scope. | 64 | 199 | 61% |
| 4 | Ambiguity of the contract documents, leading to disputes over technical specification requirements | 60 | 259 | 80% |
| 5 | Inadequate documentation to support positions and resolve issues that develop during the execution of the project or retrospectively when large claims develop at the end of the project. | 14 | 273 | 84% |
| 6 | Changed in Design criteria leads to change in mining method and leads to cost and schedule overruns. | 12 | 285 | 88% |
| 7 | Lack of co-ordination with different disciplines leads to delay in construction. | 12 | 297 | 91% |
| 8 | Insufficient time during planning stage, leads to poor planning at the beginning. | 10 | 307 | 94% |
| 9 | Logistic support was not managed properly. | 10 | 317 | 98% |
| 10 | Owners do not develop a sufficient master project schedule that results from pulling together the work activities from multiple prime contractors. | 8 | 325 | 100% |
- 4 Selection Criteria
The company prefer to focus only at 20% of the significant problems which will cover minimal 80% of the problem.
- 5 Analysis and Comparison of the Alternative
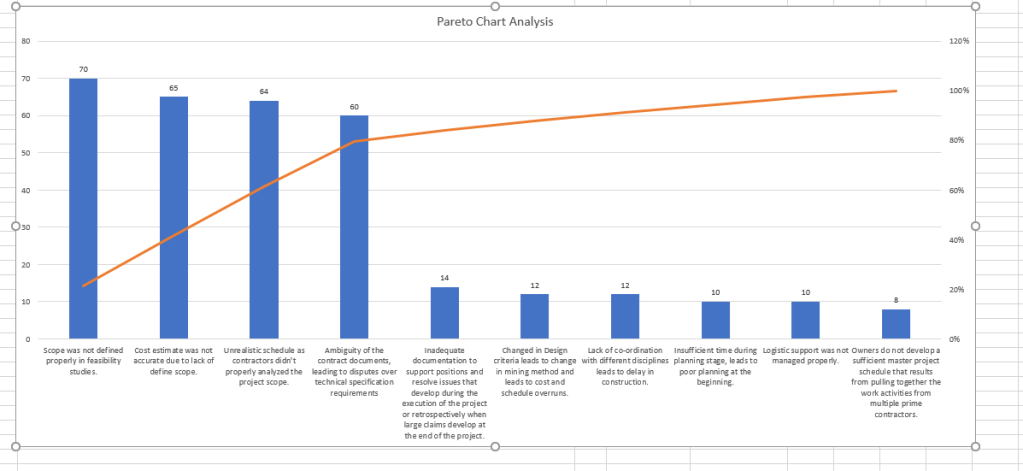
Figure 1 shows that the most problems that causing cost overrun and company shall pay attention to scope definition.
- 6 Selection of the Preferred Alternative
According to figure 1, the company should focus only on top 4 below complaint categories:
| No | Problems |
| 1 | Scope was not defined properly in feasibility studies. |
| 2 | Cost estimate was not accurate due to lack of define scope. |
| 3 | Unrealistic schedule as contractors didn’t properly analyzed the project scope. |
| 4 | Ambiguity of the contract documents, leading to disputes over technical specification requirements |
If the company can handle the above top 4 problems, it means they have solved almost 80% of the overall problems.
- 7. Performance Monitoring and the Post Evaluation of Result
After knowing the top 4 significant categories to focus on, the company needs to do several actions to solve the problems. Then they should monitor the result on quarterly basis whether a significant improvement has been achieved.
Reference
- Bassard, Michael & Riter, Diane (2010). The Memory Jogger 2nd Edition, Canada, GOAL/QPC
- McDonough, Michele (2012). Creating Pareto Chart with Microsoft Excel. Retrieved from: http://www.brighthubpm.com/templates-forms/8708-creating-pareto-charts-with-microsoft-excel/
- Laksono, Andhy (AACE Kristal 2014). W16_AL_Pareto Chart. Retrieved from: https://kristalaace2014.wordpress.com/2014/06/17/w16_al_pareto-chart/
- Haughey, Duncan (2014). Pareto Analysis Step by Step. Retrieved from: https://www.projectsmart.co.uk/pareto-analysis-step-by-step.php

Another excellent blog posting, Mr. Emanul!!! Happy to give you 5 stars but with the note if you take this same case study you could also work SMART not HARD by seeing if you can set this same problem up using Multi-Attribute Decision-making tools & techniques from Chapter 14 in EngEcon?
You also need to get into the habit of citing our Ebook or AACE’s TCM Framework or any of the other RECOMMENDED reference books from our Ebook rather than just Googling? We’ve already done much of that work for you so why not START with the work we’ve already done before you start striking out on your own?
BR,
Dr. PDG, Jakarta
LikeLike
Thank you Dr. Paul. I will add reference from recommended books. Actually I had a case study for identifying the downtime due to the equipment break down which lead to preventative maintenance of the equipment. I have enough data to post a blog. Yes, i will focus on Chapter 14 in EngEcon, will post a blog with supporting details.
LikeLiked by 2 people